博客内容Blog Content
网站服务器OOM问题排查 Troubleshooting OOM Issues on the Website Server
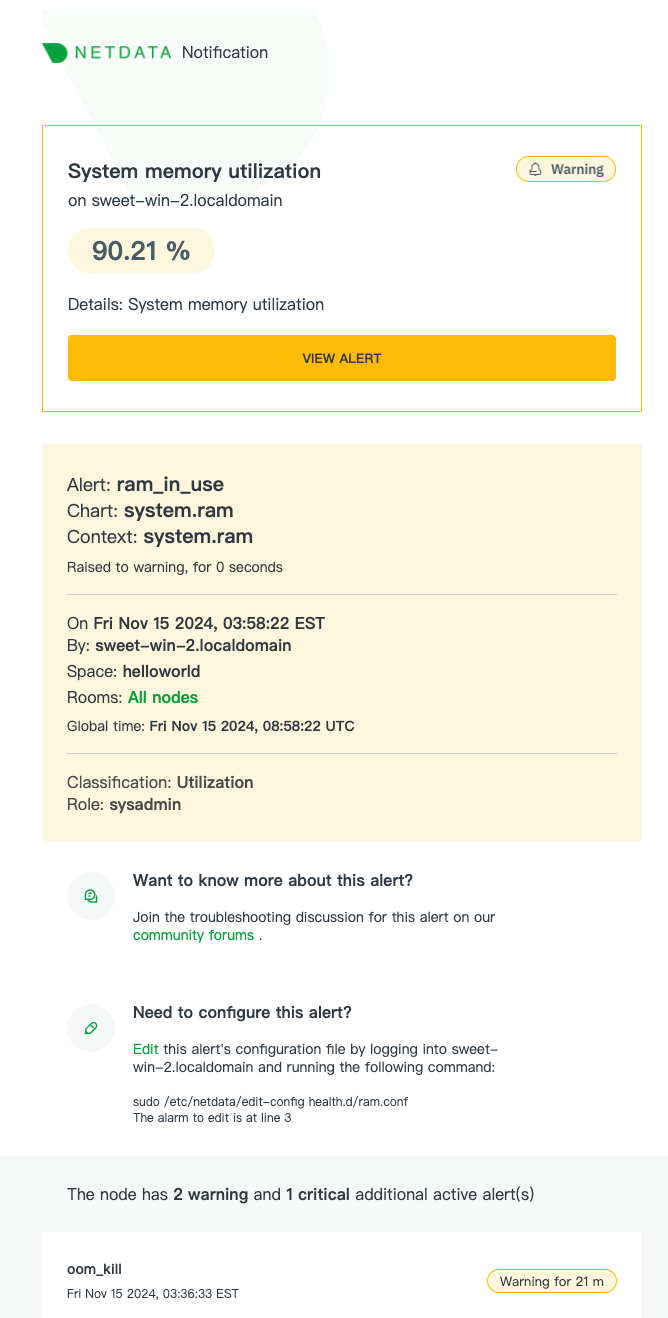
自从安装了netdata监控之后,隔三差五收到服务器OOM的邮件通知,于是尝试进行问题的排查 Since I installed the Netdata monitoring tool, I’ve been receiving periodic email notifications about OOM events on the server. So, I conducted an investigation.
背景 Background
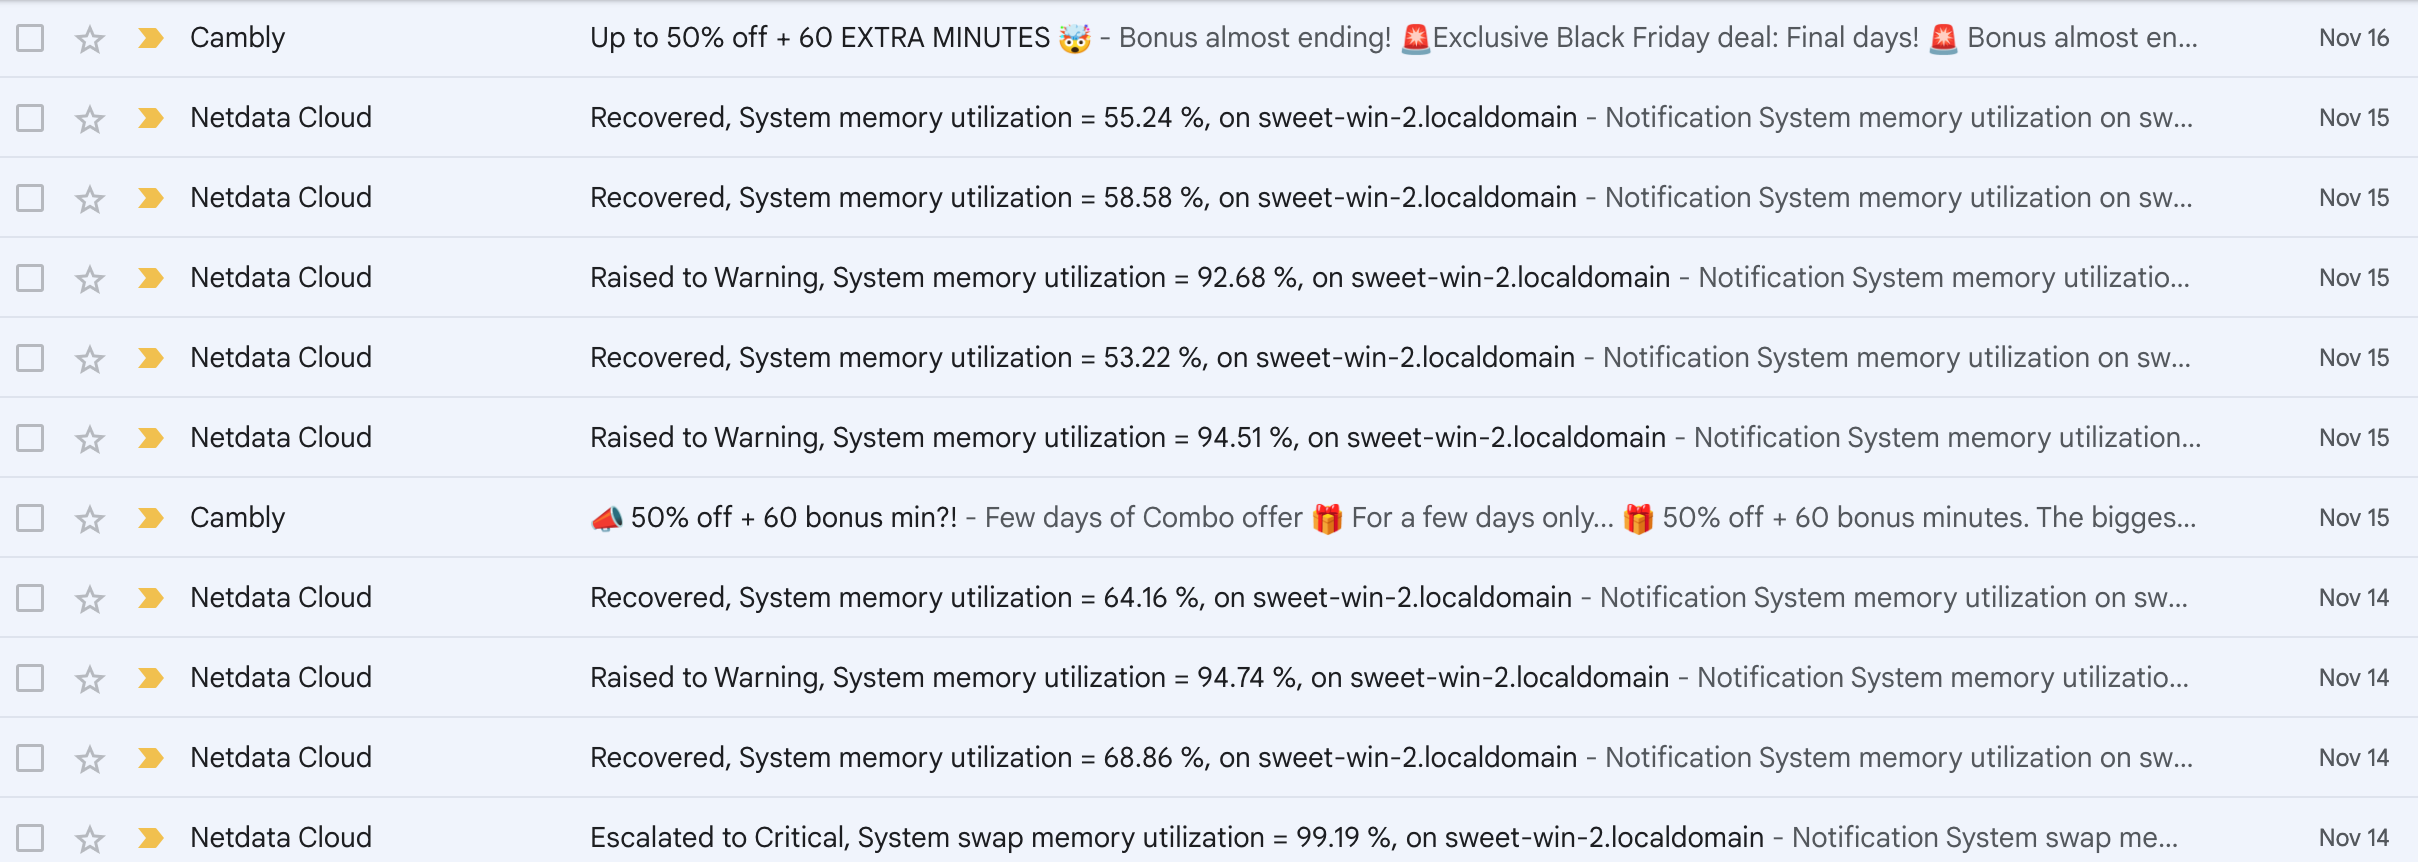
在个人网站服务器上安装了轻量级监控系统netdata之后,我发现它会经常发送一些服务器的基础监控邮件报警通知(这个功能挺好的)
After installing the lightweight monitoring system Netdata on my personal website server, I noticed that it frequently sends basic monitoring alerts via email (which is a pretty useful feature).

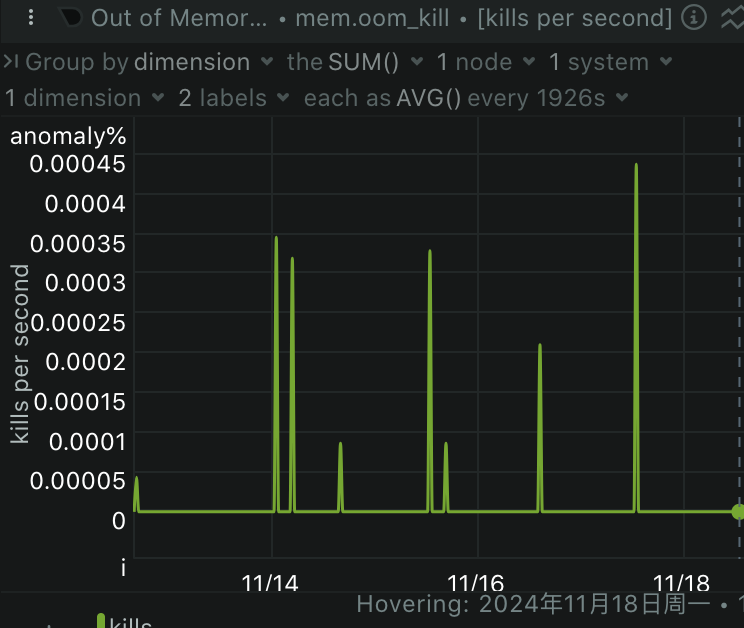
但是这也让我挺好奇,为啥会有这么多报警尤其是OOM的报警
But this also makes me quite curious, wondering why there are so many alerts, especially OOM alerts.


排查 Investigation
使用dmesg -T命令可以查看OOM记录
Use the dmesg -T command to check the OOM (Out of Memory) logs.

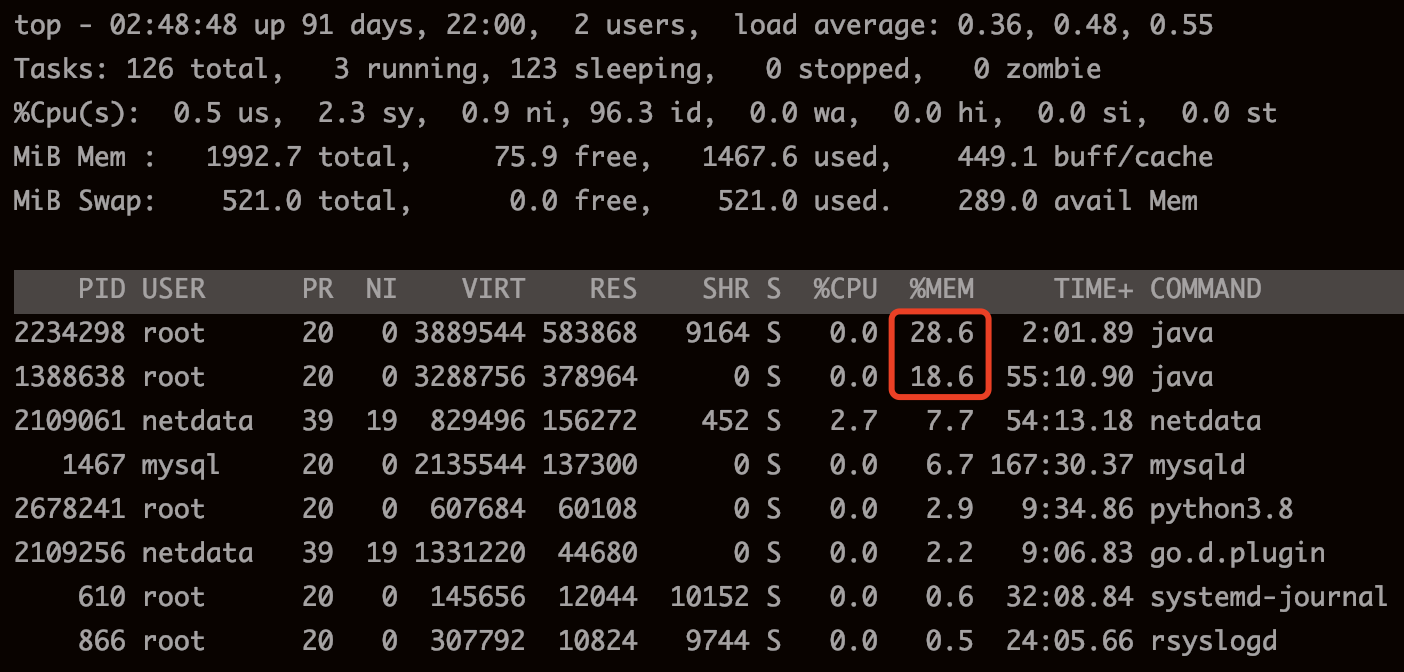
使用top+M命令看看服务器上吃内存的程序
Use the top +M command to see which programs are consuming memory on the server.

发现是两个java进程,使用ps命令查看详情
I found that two Java processes were involved, so I used the ps command to view details.

同时使用ps -p PID -o lstart确认刚才是哪个进程重启了(实际这两个进程都重启过)
At the same time, I used ps -p PID -o lstart to confirm which process had restarted earlier (in fact, both processes had been restarted).

因此根据具体信息定位到是tomcat和solr两个进程,因为都是java程序,出现OOM配置估计是jvm配置出了问题,先使用free -h命令看看目前机器内存资源
Thus, based on specific information, I identified that the issues were with the Tomcat and Solr processes. Since both are Java applications, the OOM configuration might be due to JVM configuration issues. First, I used the free -h command to check the current memory resources of the machine.

先看solr的配置,堆分配了是512m,应该是太大了超过了实际机器剩余的可用内存,所以我改小一些改成256m
Looking at Solr's configuration, the heap was allocated 512MB, which was likely too large, exceeding the available memory on the machine. So, I reduced it to 256MB.

再去看tomcat的配置,之前Xmx分配了800多m,应该也是太大了,改小到512m
Then, looking at Tomcat's configuration, the previous Xmx was set to over 800MB, which was also too large. I reduced it to 512MB.
![]()
-----------

目前Solr稳定运行了5天+,Tomcat稳定运行了几天之后,还是会莫名奇妙OOM被kill
Currently, Solr has been running stably for over 5 days, while Tomcat runs stably for about several days before mysteriously being killed by an OOM error.
尝试了好几种JVM参数(各种限制大小,以及在小内存环境下使用 ParallelGC替代G1GC),感觉都还是不行,最后花钱扩容从2G到4G看看效果(效果不错,好久没有OOM了,看监控可用内存也长期稳定)
I’ve tried several JVM parameters (various size limits and using ParallelGC instead of G1GC in a low-memory environment), but it still doesn’t seem to work. Finally, I decided to spend money to upgrade the memory from 2GB to 4GB to see if it helps (it does, there hasn't been OOM problem for a long time, and the available memory has been pretty stable for quite a while).
