博客内容Blog Content
股票量化分析入门 Introduction to Quantitative Analysis of Stocks
简单入门股票数据分析,包括基本的股票量化数据获取,简单的指标计算操作,以及相应的绘图 Simple Introduction to Stock Data Analysis: Including Basic Quantitative Data Acquisition, Simple Indicator Calculations, and Corresponding Plotting
背景 Background
作为一名炒股的韭菜,面对海量的数据信息和面对股市的起起伏伏,有时会感到难以掌控方向,亦或是没有足够的信念能克服贪欲和恐惧。虽然感觉到困难,但可以试试量化交易程序,开发自己的策略和模型,用数字和理性的方式来做决策。
As a novice stock trader, faced with overwhelming data and the ups and downs of the stock market, I sometimes feel it's hard to stay in control or lack the conviction to overcome greed and fear. Although it feels challenging, I can try quantitative trading programs, develop my own strategies and models, and make decisions in a more rational and data-driven way.
如您有数据分析和股票基础,那么便开始进行股票量化分析了,本节从最简单数据分析开始,包括基本概念,包括基本的股票量化数据获取,简单的指标计算操作,以及相应的绘图
If you have a foundation in data analysis and stocks, you can start performing quantitative stock analysis. This section begins with the simplest data analysis, covering basic concepts, including basic stock data retrieval, simple indicator calculations, and the corresponding plotting operations.

数据来源 Data Sources
Yahoo Finance
Yahoo Finance提供免费的股票、指数、ETF、期货、货币和加密货币数据。可以下载历史数据,也可以通过其 API 接口获取。
Yahoo Finance provides free data on stocks, indices, ETFs, futures, currencies, and cryptocurrencies. Historical data can be downloaded, and it also provides access through its API.
https://www.runoob.com/python-qt/qt-get-data.html
量化术语 Quantitative Terminology
策略(Strategy): 量化交易的基础是交易策略,它是一个定义了在何时、何地、以何种条件进行买卖的系统。策略可以基于技术指标、统计模型、机器学习等方法。
因子(Factor): 因子是用于衡量资产或市场特征的数值。在量化交易中,因子可以是任何与股价或交易量相关的变量,如价格、均线、市值等。
信号(Signal): 信号是根据策略和因子生成的指令,告诉投资者在何时买入或卖出。信号通常基于对市场条件的量化分析。
模型(Model): 量化交易使用数学模型来表示市场行为,这些模型可以是简单的统计模型,也可以是复杂的机器学习算法。
回测(Backtesting): 回测是在历史市场数据上模拟和评估一个交易策略的过程。回测能够提供有关策略表现的信息,但也需要小心防止过度拟合(overfitting)
Strategy: The foundation of quantitative trading is the trading strategy, which is a system that defines when, where, and under what conditions to buy and sell. Strategies can be based on technical indicators, statistical models, machine learning methods, and more.
Factor: A factor is a numeric value used to measure characteristics of an asset or the market. In quantitative trading, a factor can be any variable related to stock prices or trading volumes, such as price, moving averages, market capitalization, etc.
Signal: A signal is an instruction generated based on strategies and factors, telling an investor when to buy or sell. Signals are usually based on quantitative analysis of market conditions.
Model: Quantitative trading uses mathematical models to represent market behavior. These models can range from simple statistical models to complex machine learning algorithms.
Backtesting: Backtesting is the process of simulating and evaluating a trading strategy using historical market data. While backtesting can provide insights into a strategy’s performance, care must be taken to avoid overfitting.
基本绘图 Basic Plots
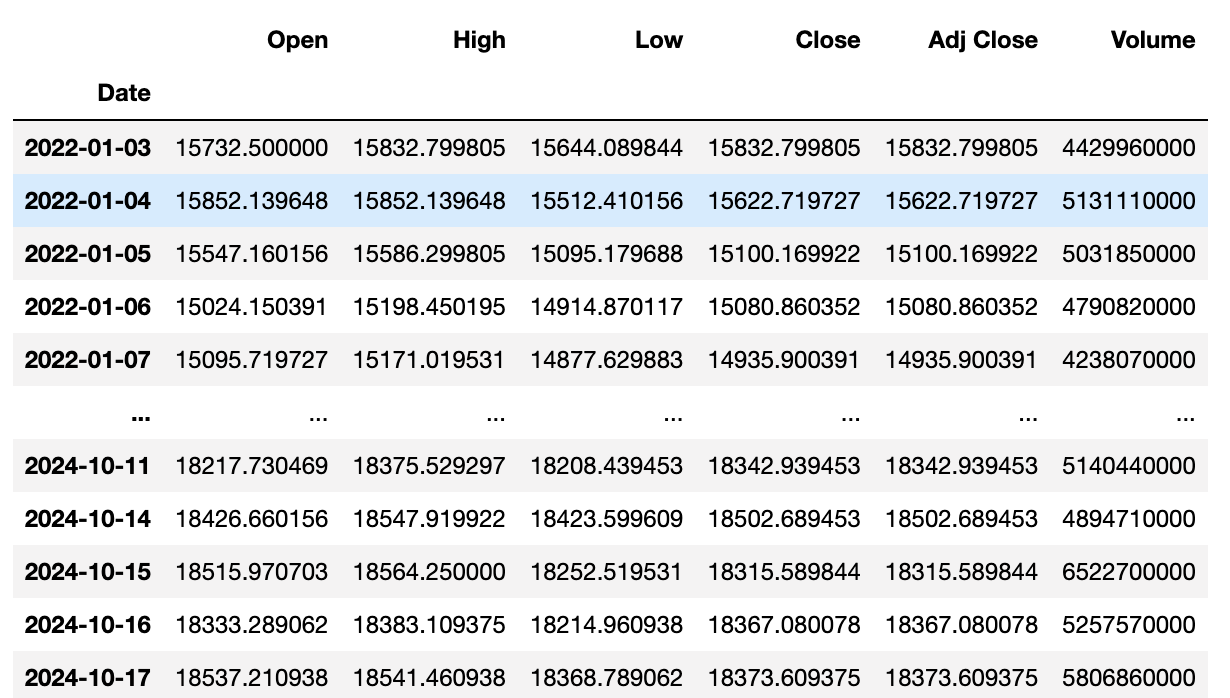
股价数据 stock price data
import yfinance as yf

# 纳斯达克指数代码
# Stock symbol for the NASDAQ index
symbol_nasdaq = "^IXIC"
# 获取纳斯达克指数数据
# Download NASDAQ index data
nasdaq_data = yf.download(symbol_nasdaq, start="2022-01-01")

# 恒生指数代码
# Stock symbol for the Hang Seng Index
symbol_hsi = "^HSI"
# 获取恒生指数数据
# Download Hang Seng Index data
hsi_data = yf.download(symbol_hsi, start="2022-01-01")

# 上证综合指数代码
# Stock symbol for the Shanghai Composite Index
symbol_shanghai = "000001.SS"
# 获取上证综合指数数据
# Download Shanghai Composite Index data
shanghai_data = yf.download(symbol_shanghai, start="2022-01-01")

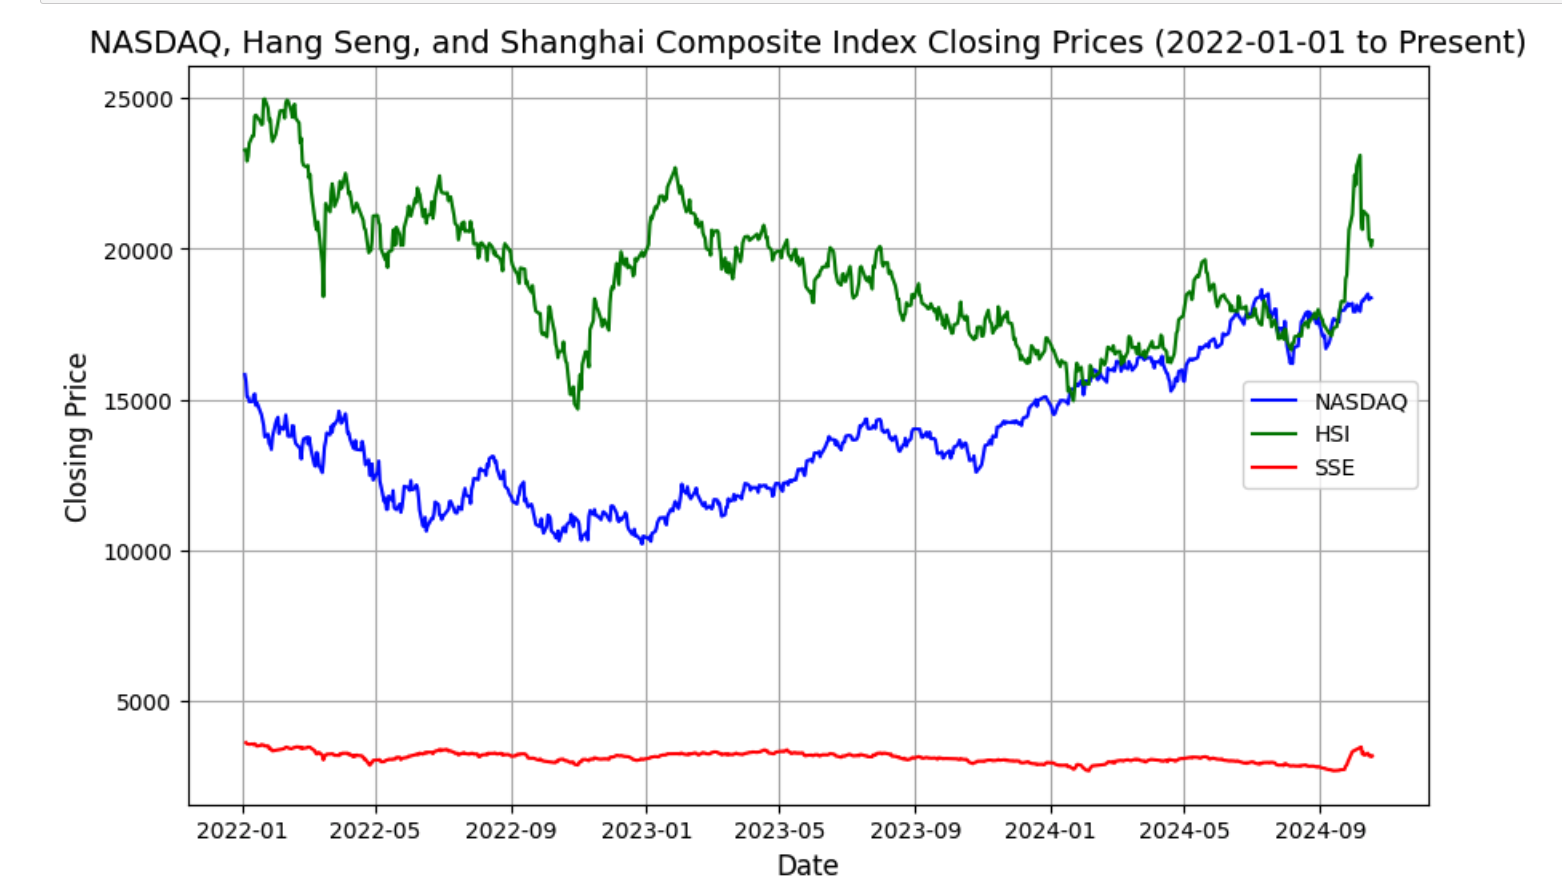
股价走势 stock price trend
# 绘制纳斯达克指数的收盘价
# Plot NASDAQ closing prices
plt.plot(nasdaq_data.index, nasdaq_data['Close'], label="NASDAQ", color='blue')

# 绘制恒生指数的收盘价
# Plot Hang Seng Index closing prices
plt.plot(hsi_data.index, hsi_data['Close'], label="HSI", color='green')

# 绘制上证综合指数的收盘价
# Plot Shanghai Composite Index closing prices
plt.plot(shanghai_data.index, shanghai_data['Close'], label="SSE", color='red')

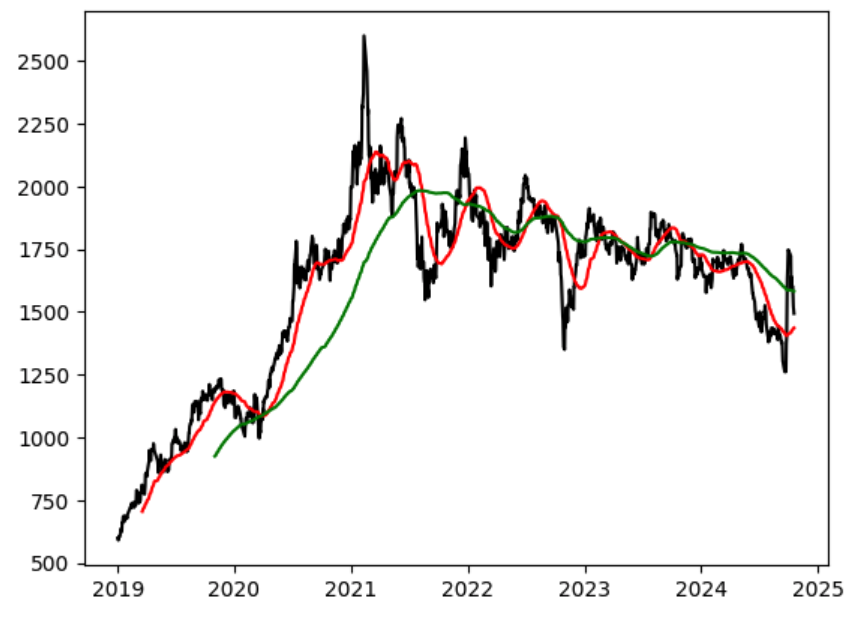
均线计算 calculate moving averages
import yfinance as yf
import pandas as pd
import matplotlib.pyplot as plt

# 获取股票数据
# Get stock data
symbol = "600519.SS"
start_date = "2019-01-01"
data = yf.download(symbol, start=start_date)

# 计算移动平均
# Calculate moving averages
data['SMA_50'] = data['Close'].rolling(window=50).mean()
data['SMA_200'] = data['Close'].rolling(window=200).mean()
plt.plot(data['Close'].index, data['Close'], label="Price", color='black')
plt.plot(data['SMA_50'].index, data['SMA_50'], label="SMA_50", color='red')
plt.plot(data['SMA_200'].index, data['SMA_200'], label="SMA_200", color='green')

标记买卖点 Mark Buy/Sell Points
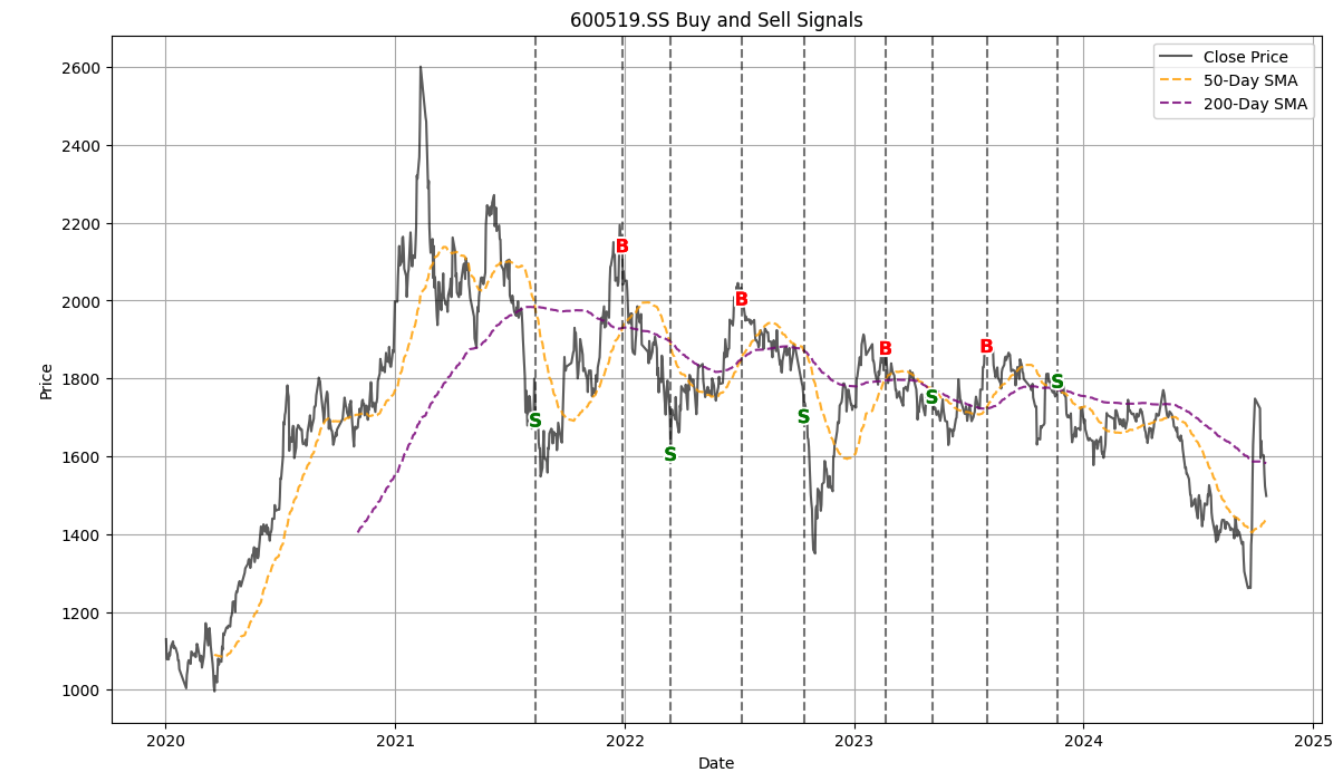
当较短期均线(如50日均线)从下方向上突破较长期均线(如200日均线)时,称为金叉。通常被视为买入信号。当较短期均线(如50日均线)从上方向下跌破较长期均线(如200日均线)时,称为死叉。通常被视为卖出信号。
When a shorter-term moving average (such as the 50-day moving average) crosses above a longer-term moving average (such as the 200-day moving average) from below, it is called a "golden cross." This is typically considered a buy signal. Conversely, when a shorter-term moving average (such as the 50-day moving average) crosses below a longer-term moving average (such as the 200-day moving average) from above, it is called a "death cross." This is typically considered a sell signal.
# 计算移动平均
# Calculate moving averages
data['SMA_50'] = data['Close'].rolling(window=50).mean()
data['SMA_200'] = data['Close'].rolling(window=200).mean()

# 初始化交叉信号列
# Initialize the signal column for crossovers
data['Signal'] = 0

# 计算交叉信号
# Calculate crossover signals
# 通过比较50日均线和200日均线,生成买卖信号:
# Generate buy/sell signals by comparing the 50-day and 200-day moving averages:
# 当50日均线高于200日均线时,Signal 设为 1,表示买入信号。
# When the 50-day SMA is above the 200-day SMA, set Signal to 1 (buy signal).
# 当50日均线低于200日均线时,Signal 设为 -1,表示卖出信号。
# When the 50-day SMA is below the 200-day SMA, set Signal to -1 (sell signal).
data.loc[data['SMA_50'] > data['SMA_200'], 'Signal'] = 1
data.loc[data['SMA_50'] < data['SMA_200'], 'Signal'] = -1

# 找到买入和卖出信号的点
# Identify buy and sell signal points
# 买入点:Signal 从 -1 或 0 变为 1
# Buy signal: Signal changes from -1 or 0 to 1
# 卖出点:Signal 从 1 变为 -1
# Sell signal: Signal changes from 1 to -1
data['Position'] = data['Signal'].diff()  # 计算信号的变化
# Calculate the change in signals
buy_signals = data[data['Position'] == 2].index  # 买入信号
# Buy signals
sell_signals = data[data['Position'] == -2].index  # 卖出信号

由图可见,至少对于A股的600519茅台,利用所谓均线的“金叉”和“死叉”进行买卖点的交易还是很不准的,甚至成为了“反向指标”
As can be seen from the chart, at least for A-share stock 600519 (Moutai), using the so-called "golden cross" and "death cross" of moving averages to determine buy and sell points is quite inaccurate and has even become a "contrarian indicator."
