博客内容Blog Content
股票涨跌方向简单预测以及评估 Simple Prediction of Stock Price Movement Direction and Evaluation
简单尝试使用一些分类模型对次日股票涨跌方向进行预测,评估数据特征和不同模型效果 A simple attempt to use some classification models to predict the next day's stock price movement direction, and evaluate the data features and the performance of different models.
原理 Principle
使用分类模型来预测股票的涨跌主要是通过对历史数据的分析,建立一个模型来预测未来股票价格是上涨还是下跌。
The use of classification models to predict stock price movements primarily involves analyzing historical data to build a model that forecasts whether the stock price will rise or fall in the future.
选择与股价相关的自变量(特征)。这些特征可以是:
Select independent variables (features) related to stock prices. These features can include:
历史股价数据(如过去几天的收盘价等时间序列数据)
技术指标(如移动平均线、相对强弱指数等)
公司财务数据(如市盈率、盈利增长等)
宏观经济指标(如利率、GDP 增长率等)
社会经济数据(如新闻情绪分析、行业趋势等)
Historical stock price data (e.g., time-series data like closing prices er the past few days)
Technical indicators (e.g., moving averages, relative strength index)
Company financial data (e.g., price-to-earnings ratio, earnings growth)
Macroeconomic indicators (e.g., interest rates, GDP growth rate)
Socioeconomic data (e.g., news sentiment analysis, industry trends)
数据预览 Data Overview
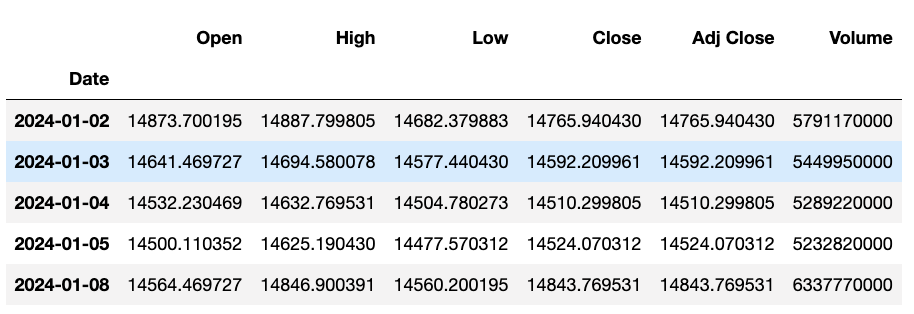
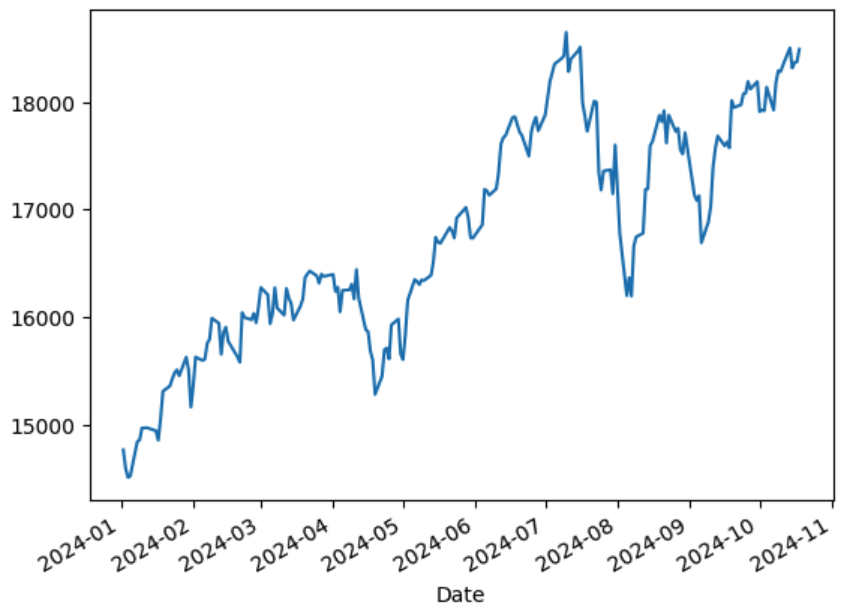
我们以纳斯达克2024年的走势数据为例,拿前部分走势和每个预测日期前7天相关数据训练,用于后面的每天是否涨跌
Using the Nasdaq 2024 trend data as an example, we use the earlier part of the trend and the relevant data from the 7 days prior to each prediction date for training, in order to predict whether the market will go up or down in the following days.
先预览下数据:
Let's first preview the data:
import yfinance as yf
import numpy as np
import pandas as pd
import matplotlib.pyplot as plt

# 下载纳斯达克指数的历史数据
# Download historical data for the NASDAQ index
symbol = "^IXIC"
nasdaq = yf.download(symbol, start="2024-01-01")
nasdaq.head()

nasdaq['Close'].plot()


评估预测效果 Assessment of Prediction Effect
数据集划分、结果分类、使用不同的模型预测效果并绘制混淆矩阵
Dataset splitting, result classification, using different models to predict outcomes, and plotting the confusion matrix.
import yfinance as yf
import numpy as np
import pandas as pd
import matplotlib.pyplot as plt
from sklearn.linear_model import LogisticRegression
from sklearn.ensemble import RandomForestClassifier
from sklearn.svm import SVC
from sklearn.neighbors import KNeighborsClassifier
from sklearn.model_selection import train_test_split
from sklearn.metrics import accuracy_score, classification_report, confusion_matrix
from sklearn.ensemble import GradientBoostingClassifier
from sklearn.neural_network import MLPClassifier
def prepare_classification_labels(y):
    """
    Convert stock prices into binary classification labels based on price movement.
    将股价转换为二分类标签:上涨(1) 或 下跌(0)
    """
    labels = []
    for i in range(1, len(y)):
        if y[i] > y[i - 1]:  # Price went up
            labels.append(1)
        else:  # Price went down or stayed the same
            labels.append(0)
    return np.array(labels)
def predict_stock_trend(X, y):
    X = np.array(X)
    y = np.array(y)
    # Convert the continuous target (y) into classification labels (1 for up, 0 for down)
    # 将连续的目标 (y) 转换为分类标签 (1 表示上涨,0 表示下跌)
    y_class = prepare_classification_labels(y)
    # Ensure that X and y_class have the same length (due to the shifting in prepare_classification_labels)
    # Since prepare_classification_labels skips the first value
    # 保证X和y长度相同,去掉第一个无法预测的点
    X = X[1:]
    # Split the data into training and testing datasets
    # 将数据划分为训练集和测试集
    X_train, X_test, y_train, y_test = train_test_split(X, y_class, test_size=0.2, shuffle=False)

    # Define models to compare
    # 定义要对比的模型
    models = {
        'Logistic Regression': LogisticRegression(max_iter=1000),
        'Random Forest': RandomForestClassifier(n_estimators=100, max_depth=10, min_samples_split=5, random_state=42),
        'Support Vector Classifier': SVC(),
        'K-Nearest Neighbors': KNeighborsClassifier(n_neighbors=5),
        'Gradient Boosting Classifier': GradientBoostingClassifier(),
        'MLP Classifier': MLPClassifier(hidden_layer_sizes=2 * [256], learning_rate_init=0.01, max_iter=10000)
    }
    # Initialize a dictionary to store results
    # 初始化一个字典来存储结果
    results = {}
    # Train, predict, and evaluate each model
    # 针对每个模型进行训练、预测和评估
    for model_name, model in models.items():
        # Train the model
        # 训练模型
        model.fit(X_train, y_train)
        # Make predictions
        # 对测试集进行预测
        y_pred = model.predict(X_test)
        # Calculate accuracy
        # 计算预测的准确率
        accuracy = accuracy_score(y_test, y_pred)
        # Generate classification report
        # 生成分类报告
        class_report = classification_report(y_test, y_pred, zero_division=0)
        # Calculate confusion matrix
        # 生成混淆矩阵
        conf_matrix = confusion_matrix(y_test, y_pred)
        # Store the results
        # 存储结果
        results[model_name] = {'Accuracy': accuracy, 'Classification Report': class_report, 'Confusion Matrix': conf_matrix}
    # Print the results for each model
    # 打印每个模型的结果
    for model_name, metrics in results.items():
        print(f"{model_name}:")
        print(f"Accuracy: {metrics['Accuracy']*100:.2f}%")
        print(results[model_name]['Confusion Matrix'])
        print()
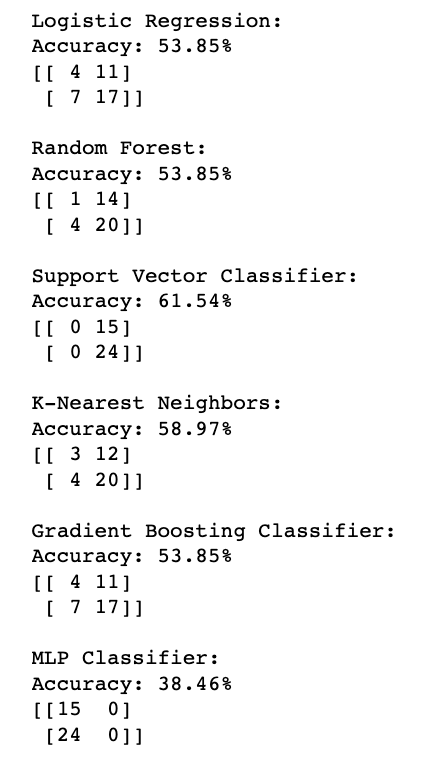
只使用收盘价预测 Using Close Price Only
# Use only the closing prices
# 只使用收盘价
close_prices = nasdaq['Close']

# Prepare features (X) and target (y) data
# 前7天的收盘价作为特征,第8天的收盘价作为目标
window_size = 7
X = []
y = []
for i in range(len(close_prices) - window_size):
    # Extract the window of 7 days of closing prices and volumes as features
    # 提取前7天的收盘价作为特征
    closing_window = close_prices.iloc[i:i + window_size].values
    X.append(closing_window)

    # The 8th day's closing price as the target
    # 提取第8天的收盘价作为目标
    y.append(close_prices.iloc[i + window_size])
predict_stock_trend(X, y)

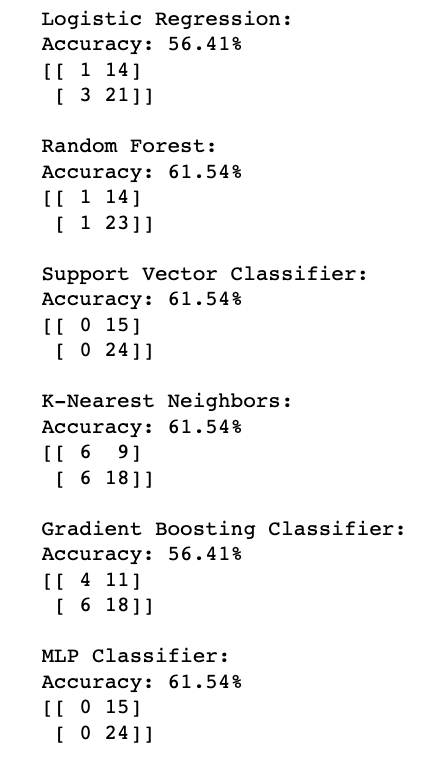
加入更多特征 Adding More Features
# Use closing prices, volumes, high and low prices
# 使用收盘价、成交量、最高价和最低价
close_prices = nasdaq['Close']
volumes = nasdaq['Volume']
high_prices = nasdaq['High']
low_prices = nasdaq['Low']
# Prepare features (X) and target (y) data
# 前7天的收盘价、涨跌幅、成交量涨跌幅、最高价、最低价作为特征,第8天的收盘价作为目标
window_size = 7
X = []
y = []
for i in range(len(close_prices) - window_size):
    # Extract the window of 7 days of closing prices, volume, high, and low prices
    # 提取前7天的收盘价、成交量、最高价和最低价
    closing_window = close_prices.iloc[i:i + window_size].values
    volume_window = volumes.iloc[i:i + window_size].values
    high_window = high_prices.iloc[i:i + window_size].values
    low_window = low_prices.iloc[i:i + window_size].values
    # Calculate the percentage change (price and volume) for the last 7 days
    # 计算最近7天的价格涨跌幅和成交量涨跌幅,并用 fillna(0) 处理 NaN 值
    price_pct_change = close_prices.pct_change().fillna(0).iloc[i:i + window_size].values
    volume_pct_change = volumes.pct_change().fillna(0).iloc[i:i + window_size].values

    # Replace inf or -inf values with 0 to avoid issues
    # 将 inf 或 -inf 替换为 0 以避免问题
    volume_pct_change = np.where(np.isinf(volume_pct_change), 0, volume_pct_change)
    # Concatenate all features: closing prices, price percentage change, volume percentage change, high, and low prices
    # 将收盘价、价格涨跌幅、成交量涨跌幅、最高价和最低价合并为特征
    features = np.concatenate([closing_window, price_pct_change, volume_window, volume_pct_change, high_window, low_window])
    X.append(features)

    # The 8th day's closing price as the target
    # 提取第8天的收盘价作为目标
    y.append(close_prices.iloc[i + window_size])
predict_stock_trend(X, y)

总结与思考 Summary and Reflections
(1)对比可以发现,同样是简单的分类模型,加入更多特征之后准确率会提高一些,但最终效果并不算很准
(2)训练时不同的数据角度对训练结果有较大影响,比如当调整近7天的参数范围,或者调整训练数据的时间范围不止2024年,这些都会显著影响预测效果;但这符合预期,因为不同时间的风格和各种基本面肯定是不一样的
(3)预测涨跌幅只是探索量化的第一步,后面还有很多方向可以探索:比如预测可能的大涨大跌、超买超卖点等,再做专业点还有各种回测和量化策略的构造
(1)By comparison, we can see that even with simple classification models, adding more features slightly improves accuracy, but the final results are still not very precise.
(2)The angle of the data used for training has a significant impact on the results. For example, adjusting the parameter range of the past 7 days or expanding the training data beyond just 2024 can significantly affect the prediction results. However, this is expected, as different time periods have varying styles and fundamentals.
(3)Predicting price movements is just the first step in exploring quantitative analysis. There are many directions to explore further, such as predicting potential large gains or losses, identifying overbought or oversold points, and for more advanced applications, constructing various backtesting and quantitative strategies.
总之,虽然没人能准确预测股市的走向,但挖掘更多的数据、训练及调整更好的模型,提高准确度有助于我们做决策。
In conclusion, while no one can accurately predict the stock market's direction, digging deeper into data, training and fine-tuning better models, and improving accuracy can help us make better decisions.
